The Dilemma between Saving the Earth and Enjoying the Gains brought on by Plastic Waste for Developing Countries. Where are microplastics found? And where does it all come from? We dig a little deeper, and look at the dilemma faced by countries the world over.
By Ana Yong
The modern world would not be what it is now without plastics, for example, computers and mobile phones would not be available to the masses without the plastic exteriors which house these devices.
Slowly but surely conquering every corner of the earth are microplastics (less than five millimeters or 0.2 inches in diameter) which constitute breakoffs from larger pieces of plastic like plastic bags or bottles and other plastic products.
Further Reading:
- The Effects of Microplastics on Humans: An Introduction
- The Plastic Waste Dilemma and China’s National Sword Policy
Introduction: Where do Microplastics Come From?

View of the Earth as seen by the Apollo 17 crew traveling toward the moon
Photo by NASA on Unsplash
Clothing made from synthetic (plastic) fibers contribute around 8% of European microplastics to oceans annually, which is between 200,000 and 500,000 tons. As the bulk of microplastics are discharged from garments during the initial few washes, fast fashion clothing constitutes a large proportion of first washes as these garments are rapidly replaced by newer and more current styles.

According to the European Environment Agency, plastic litter can come from sea-based sources, land-based bases and the disintegration of synthetic waste. About 6-15 million tons, which constitute 2-4% of global production, go into the environment each year.

According to abc.net.au, microplastics come from:
- Degradation of road-marking paints and tyre debris,
- Fragments discharged from textiles when washed or from deterioration,
- Wear and tear arising from shoe soles and artificial turf (plastic grass and plants),
- Industrial plastics utilized for mulching (materials used to cover agricultural soil to reduce moisture loss),
- Plastic microbeads used in make-up,
- Degenerated bits of consumer products flushed down toilets and sinks,
- Nurdles (plastic raw materials in the pre-production stage)
- Disintegrated fishing nets,
- Pipes and other components used in treatment plants which are made of plastic, and
- Bottles and bottle caps used for drinking water.

4Ocean’s article entitled “8 Major Products Contributing to Plastic Waste in the Ocean” dated 19 March 2020 mentioned that plastic waste comes from bottles, synthetic fabrics, plastic bags, cigarette butts, microbeads, straws, fishing gear, and plastic packaging.
The United Nations Environment Programme (UNEP) stated in their interactive social message called “Our planet is choking on plastic” that “Cigarette butts – whose filters contain tiny plastic fibers – are the most common type of plastic waste found in the environment”. All the while, rivers and lakes are the main contributors of marine waste by transporting plastic trash from inshore locations to the sea.
The International Union for Conservation of Nature (IUCN) highlighted that more than 300 million tons are created annually and no less than 14 million tons culminate in the sea, which make up 80% of all oceanic waste. This leads to marine organisms consuming the plastic debris which could result in injury or mortality.

Countries with the Most Plastic Pollution
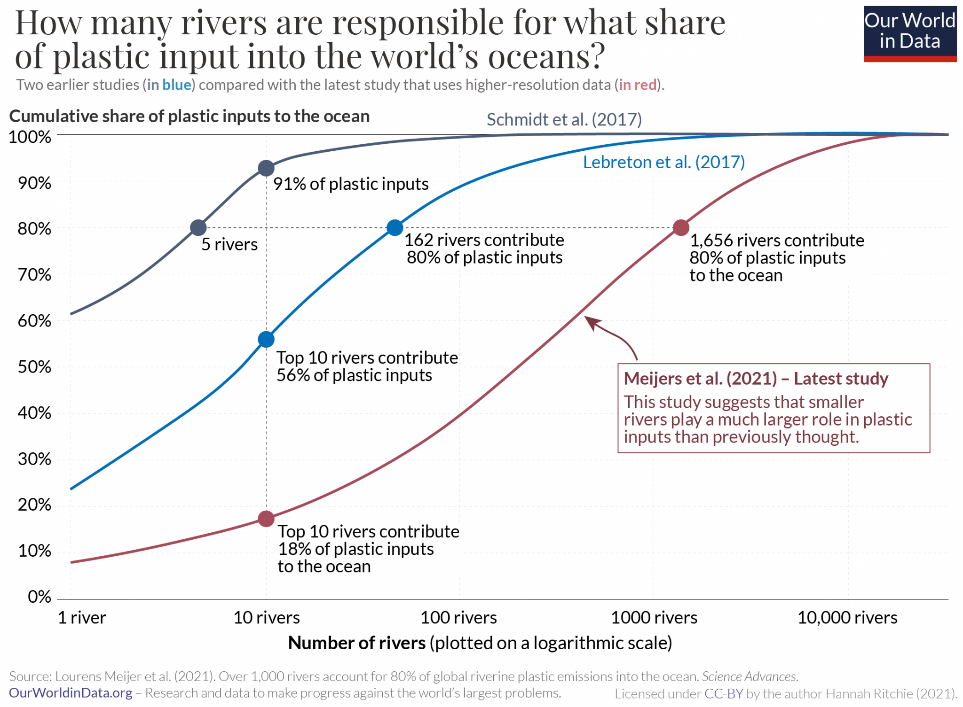
An article by Our World in Data entitled “Where does the plastic in our oceans come from?” dated 1 May 2021 stated that while 80% of marine plastics come from rivers and coastlines, the other 20% originate from maritime products like fishing nets and ropes.
The most up-to-date research (refer to the red line in the diagram below called “How many rivers are responsible for what share of plastic input into the world’s oceans?”) suggests that compared to earlier studies, the top 10 polluting rivers supply a smaller quantity than was formerly thought of, at 18% of plastic waste as opposed to 56% and 91% stated in earlier findings (by Lebreton et al 2017 and Schmidt et al 2017). But in order to explain the 80% of river plastics, analyses must include the leading 1,656 rivers. This is in contrast to preceding examinations which listed that the largest 5 or 162 rivers were answerable for the 80%.
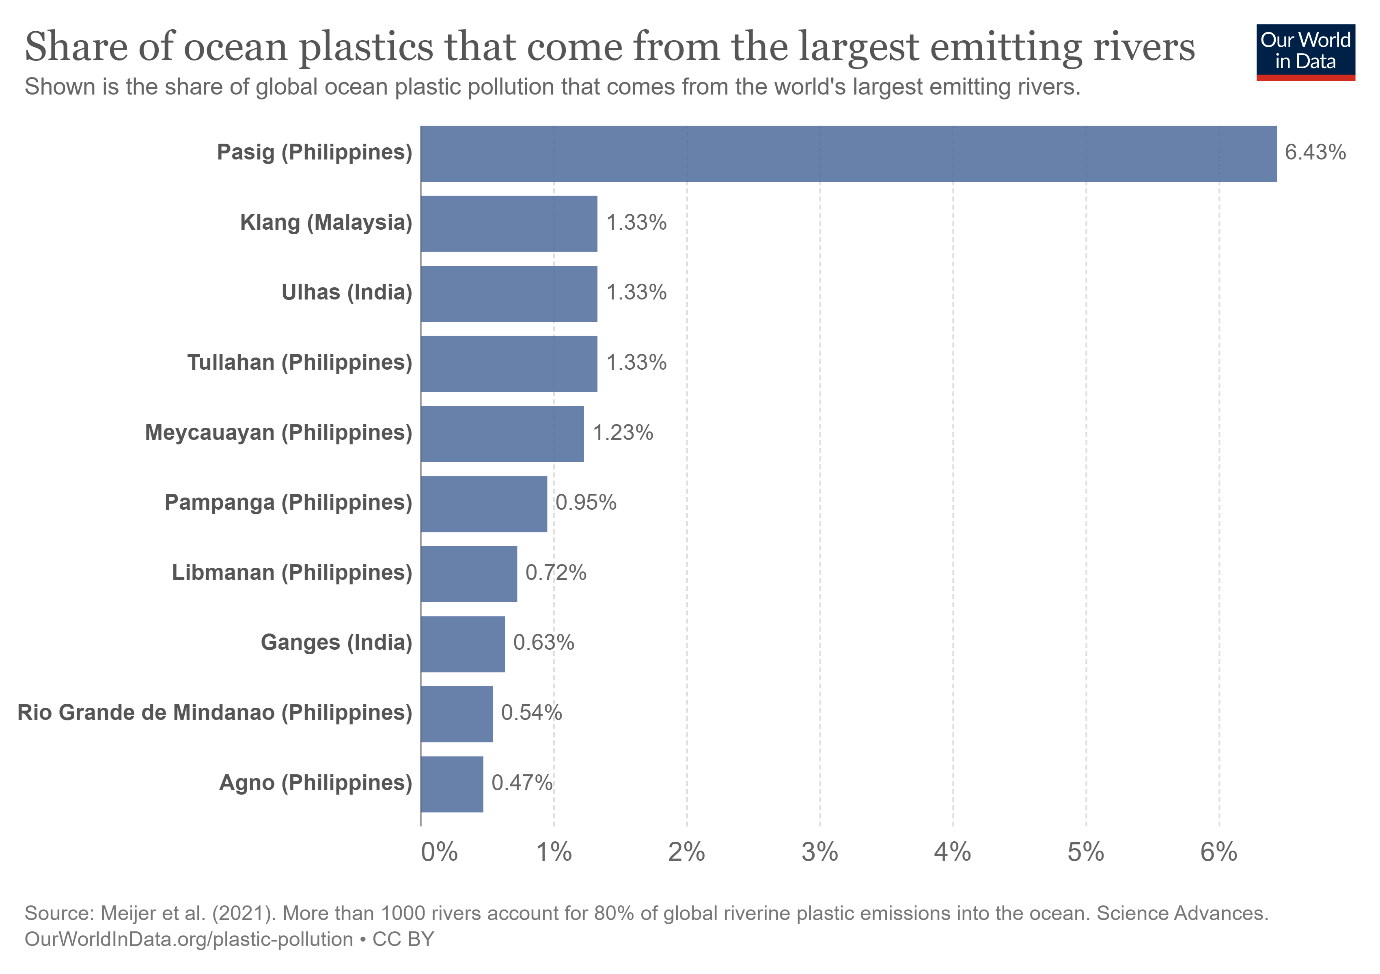
Asia released 80.99% of oceanic plastic in 2019 with 7 rivers in the Philippines making up the top 10 rivers in Asia (refer to the next 2 charts).

An article by euronews.com entitled “Ranked: The top 10 countries that dump the most plastic into the ocean” dated 22 June 2021 stated that India was the top country in 2020 dumping 126.5 million kilograms of plastics per year. However, it was not the largest plastic waste producing country. This title goes to the United States of America which generates 42 billion kilograms annually but only 2.4 million kilograms culminate in the seas. This is because the United States exports their plastic garbage to other countries including India.
On 6 March 2019, an article by Plastic Pollution Coalition called “157,000 Shipping Containers of U.S. Plastic Waste Exported to Countries with Poor Waste Management in 2018” declared that since China had stopped accepting imports of plastic waste at the start of 2018, the United States had to ship their plastic waste exports to other countries to be recorded as ‘recycled’ to avoid paying disposal costs and to reduce the environmental impact to local communities.
Characteristics of the Largest Emitting Rivers
The diagram above entitled “Share of ocean plastics that come from the largest emitting rivers” shows that apart from the top 7 rivers originating from the Philippines, 2 are from India and 1 in Malaysia, with the Pasig River (Philippines) making up for 6.43% of worldwide river plastics.
Rivers that release the most plastics share the following features:
a) Weak Waste Administration
This leads to a huge quantity of mishandled plastic waste going into rivers and oceans.
b) Proximity to Cities
As such cities have a developed infrastructure like paved roads that would not accumulate plastic debris on the streets, both water and plastic would be washed into river outlets.
c) High Precipitation Rates
As the flow rate of such rivers to the oceans is high, a lot of plastic waste is washed into the sea.
d) Nearness to Coastlines
Since these rivers are close to the shoreline, plastic debris is easily washed to the ocean.
For more up to date information, the Ocean Cleanup Project has created an interactive map that shows the contribution of plastic waste by each of the world’s rivers, do take a look here.
Relationship between Plastic Waste and Developing Countries
For many years, developed and financially robust countries have been shipping their plastic litter to less developed and economically weaker countries as an easy way out from domestic environmental and sociological demands.
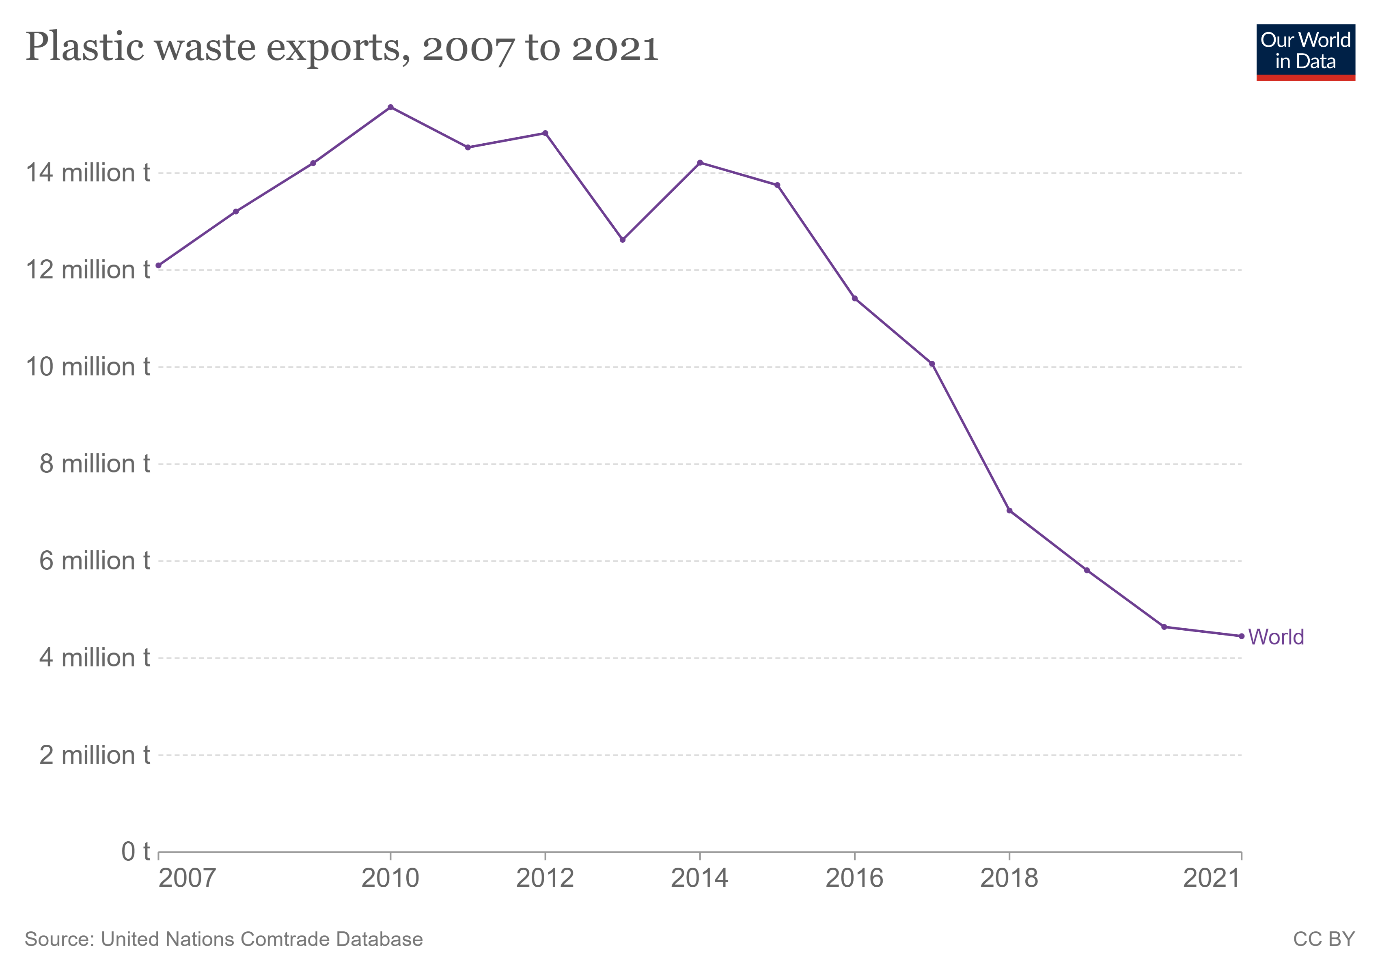
An article called “Ocean plastics: How much do rich countries contribute by shipping their waste overseas?” by Our World in Data dated 11 October 2022 indicated that developing countries that import plastic waste would recycle these into other products by placing them into manufacturing industries because this was more economical than purchasing or producing virgin plastics from the start. About 5 million tons of plastic scrap were traded globally in 2020 (see diagram below).
Since approximately 350 million tons of plastic debris are generated annually, 5 million tons constitute only 2% which means that 98% is managed domestically via landfills, recycling systems or incinerated in the territory where the plastics were produced.
An academic paper by Nature Communications entitled “China’s plastic import ban increases prospects of environmental impact mitigation of plastic waste trade flow worldwide” dated 18 January 2021 stated that although China has ceased accepting plastic waste imported from other countries in 2018, the prohibition is only on importing unwanted plastic scraps but not recycled plastic parts. This agreement provides an alternative for rich nations to ship recycled plastic exports should the need arises.
A creatively designed infographic by Visual Capitalist called “Mapping the Flow of the World’s Plastic Waste” (3 July 2019) declared that the top 4 plastic exporting countries from January to November 2018 were the United States, Japan, Germany, and the United Kingdom while the top 4 plastic importing countries from the same period were Malaysia, Thailand, Vietnam, and Hong Kong.
When China carried out the ‘National Sword’ policy in 2018 to ban plastic waste imports, advanced countries started to ship them to other countries. According to Basel Action Network (BAN), global exports from the top 10 countries decreased from 4.41 million tons yearly in 2020 to 3.75 million tons per year for 2021. For information on the amount of plastic waste exported from 2017 to 2021, refer to the diagram below.

At the point of writing, the main exporting countries and regions were:
- United Kingdom,
- United States of America,
- the European Union,
- Canada,
- Japan,
- Germany, and
- Australia.
Similarly, the core importing countries and regions were:
- Hong Kong,
- Indonesia,
- India,
- Latin America,
- Thailand,
- Malaysia,
- Turkey, and
- Vietnam.
To see the annual summary or monthly data for the above countries and regions, click here.
BAN has teamed up with graduate students Matthew Gordon (Yale University) and Anna Papp (Columbia University) to create and maintain the Atlas of Plastic Waste. The project was created to gather information from the general public to be used together with data obtained from satellites and computer applied sciences, to locate and verify places around the world where plastic refuse end up in the physical environment.
Information gathered will be used to create an international database to show each and every dump site where plastic litter (equivalent to the volume of a large city bus) is left behind. If you have such information and wish to make a submission, click here.
Costs and Benefits of Plastic Waste Exports to Developing Countries
By shipping plastic waste to avoid paying high penalties for recycling and to mitigate the ecological effects of dumping at local landfills and incineration, exporting nations have created an ‘out-of-sight and out-of-mind’ mentality.
The economic benefits to developing nations have been listed by various publications and some of them are mentioned below:
An article named “Plastic waste has some economic benefit for developing countries” by Washington State University dated 27 May 2021 declared that economically weaker countries experienced a growth in Gross Domestic Product (GDP) Per Capita when accepting plastic waste imports from developed countries. Note: GDP per capita calculates a nation’s economic output per person by dividing the GDP of a country by its population.
The Geneva Environment Network updated their research (10 November 2022) on Plastics and Trade which is part of the Plastics and the Environment Series and declared that “in 2021, plastics trade reached records-high at 1.2 trillion USD”. And that 8 million metric tons of plastic waste were traded globally in 2018 which amounted to about 3.3 billion US dollars. The information was based on Research Paper No. 53 published by the United Nations Conference on Trade and Development (UNCTAD) in December 2020.
In developing countries where there are weak measures in recycling systems for imported plastic debris, an illegal trade has arisen with a projected worth of between €4-€15 billion in the European Union alone (The Environmental Investigation Agency’s newsletter dated September 2021).
Global Waste Cleaning Network’s article called “Global Waste Trade and its Effects on Landfills in Developing Countries” dated 14 November 2021 stated that the global plastic waste trade was valued at about $98.3 billion from 1988 to 2016 for importing nations.
While developing countries are ready and willing to accept imported plastic litter, they often have inadequate waste management or recycling capabilities. In addition, these nations are experiencing brisk urbanization and together with a growing middle class, a host of ecological and health problems would follow:
Referring to a culture of disposability, the World Bank’s article named “Plastic waste is a growing menace, and a wasted opportunity” dated 6 April 2021 declared that for Thailand, the Philippines and Malaysia, “more than 75% of the material value of recyclable plastic is lost — the equivalent of $6 billion a year when single-use plastic is discarded rather than recovered and recycled”.
Emerging economies also do not have a practice of collecting, sorting, reusing and recycling plastics. Local populations have to be educated and convinced to participate in these measures especially when they do not see the need or are not aware of the hazardous consequences of throwing away used plastics.
Implementing a suitable infrastructure and having adequate policies go a long way in inculcating the recycling mindset. As it is more convenient and faster to dispose of used plastics in landfills or incinerate them, the governments of these economies should set the precedence in meeting the plastics challenge.
Environmental Defence produced an article called “Burning Plastic Is a Terrible Idea. Here’s Why” dated 18 March 2022 stated that burning plastics not only creates greenhouse emissions but also Dioxins and Furans which are cancer-causing agents. In addition, burning does not remove the plastic completely as 30% of it is left behind in the form of ash or some other by-product which eventually seeps into the ground and pollutes the environment.
Building and maintaining an incineration plant is expensive and in order for it to be a viable business, the establishment must incinerate a lot of plastics and for many years to come, thereby producing large amounts of greenhouse gases and carcinogens. People working at or staying near such places would also develop health issues.
Last Word
Recycling plastics is not a straightforward issue of exporting them to other nations because what happens in other countries ultimately affects everyone on the planet. For example, less wealthy economies may choose to burn imported plastic waste as a fast and simple way of disposing it, but the global air pollution generated impacts us all.
As inconvenient as it may be, all nations should have a tighter rein when it comes to producing plastic and managing its entire life cycle so that the plastics conundrum could be tackled collectively.